PHIARC
HYPE is having a cycle. Robinhood is having a different cycle. The way two of the market's loudest signals pull apart and snap back, who leads and by how much, traces a loop in price space. The signed area of that loop has a name in physics, written down in Bangalore in 1956. PHIARC keeps the count.
↓ enter the live instrument
What this is.
Hyperliquid is having the loudest quarter of any L1 in 2026. Robinhood is having a different quarter. HYPE and Robinhood are now on very different trajectories, and that is exactly when the measurement becomes interesting.
Take a HYPE price and a Robinhood price at the same minute. You have one point on a 2D plane. Do it for 256 minutes and you have a curve. The curve sometimes closes a small loop, and each loop encloses an area. The area has a sign, and the running total is the PHIARC phase. The sign of the total tells you who has been leading.
PHIARC is the page that keeps this running total. It reads the same public Hyperliquid feed anyone else can read, and it appends each new segment as it comes in. The reading is the product.
What a geometric phase is.
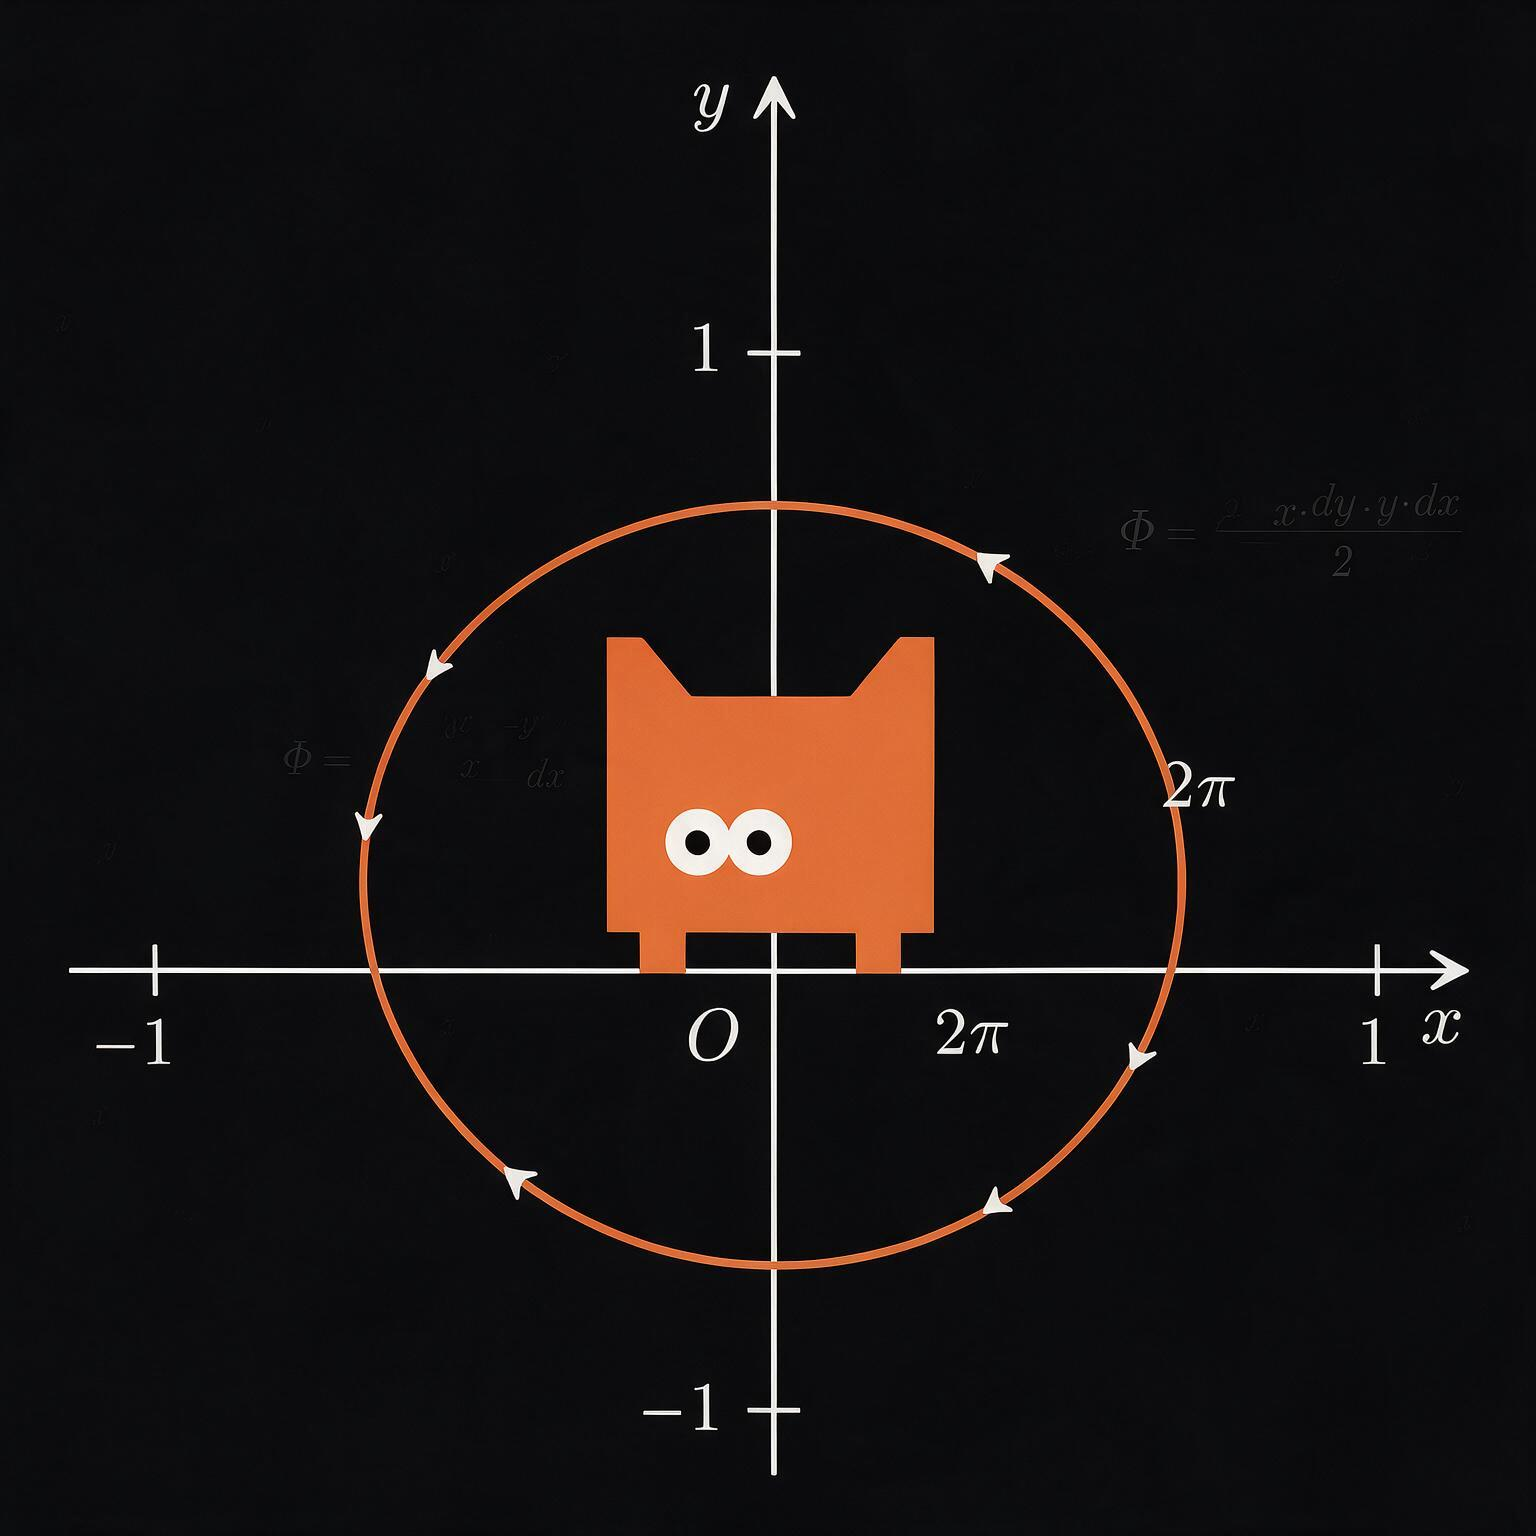
Stand at the north pole. Walk south to the equator. Turn ninety degrees and walk along the equator for a while. Turn ninety degrees again and walk back up to the pole. You are now facing a different direction than when you started, even though every turn was exactly ninety degrees.
The extra rotation did not come from your turns. It came from the curvature of the surface you walked on, and its size equals the area of the triangle you traced. This is the geometric phase. It belongs to the path, not to the speed.
A Foucault pendulum is the same effect. Hang a heavy weight from a long string, let it swing, and over twenty-four hours the swing plane rotates by an angle equal to 2π times the sine of the latitude. Nobody pushed it. The earth's curvature did.
In 1956 a young Indian physicist showed that light passing through a sequence of polarizers picks up the same kind of phase. In 1984 a British physicist rediscovered it for quantum mechanics. It now carries both their names.
Two prices on a plane work the same way.
How it applies to HYPE and Robinhood.

Take the HYPE perp midprice and the Robinhood perp midprice at the same minute. Plot them as one point, HYPE on the horizontal axis and Robinhood on the vertical. Do this for 256 minutes. You now have a curve in two-dimensional space.
The curve has four characteristic shapes.
- When the two assets move in perfect lockstep, the curve sits along a straight diagonal. It encloses nothing. Φ stays at zero.
- When HYPE moves first and Robinhood chases, the curve drifts above the diagonal on the way up and returns below it on the way down, tracing clockwise loops. Φ runs negative.
- When Robinhood leads instead, the loops go counterclockwise and Φ runs positive.
- When the lead alternates evenly between the two, clockwise and counterclockwise loops cancel and Φ holds near zero.
The integral that turns this picture into a number was written down in 1956. It is the signed area element (x dy − y dx) / 2, summed along the trajectory. The output is a single scalar, accumulating one segment at a time, that compresses the entire lead-lag history of the pair into one running total.
How the measurement runs.
The instrument is this page. When you open it, your browser opens a connection to Hyperliquid's public info endpoint, asks for the last 256 one-minute candles for HYPE and for Robinhood, and waits for the response.
What comes back is the same data anyone else asking for it would receive. There is no private feed, no team server in the middle, no curated mirror, no permissioned oracle. The endpoint is open, the candles are public, and the request is the same one a trading bot would make.
From there, the procedure is four steps. Detrend each series against its own rolling baseline and scale the residual to unit variance, so HYPE and Robinhood share a common axis without either asset's long-arc trend dominating the picture. Walk through the 256 points in time order. At every step, add the signed area element (x dy − y dx) / 2 to a running total. Draw the result on the chart above this section.
The whole computation finishes in about a millisecond and uses no information that is not already on the public Hyperliquid endpoint. The page is doing the same thing a careful trader could do for themselves by hand. PHIARC is the project that commits to doing it, on a fixed window, with a fixed procedure, in the open, every time anyone visits the page.
Why 2π.
2π is the angle of one full revolution. It is the natural unit of any geometric phase, the same way the meter is the natural unit of length. Nobody chose it. It has been the same number for as long as anyone has done geometry, and it will still be the same number long after this project, and the markets it watches, have been replaced by something else.
The chart marks plus and minus 2π as horizontal reference lines. When Φ(t) crosses one of them, the joint HYPE × Robinhood state has wound once around the diagonal. Nothing on the page announces the crossing. Nothing in the procedure rewards it. It simply happens, and the count moves up by one.
There is one constant in the whole procedure. It is 2π. It is what it is.
Why PHIARC.
PHIARC joins Φ, the symbol for the accumulated phase, with the arc traced by two prices moving through the same plane. The name carries the entire instrument in six letters: phase, path, and the area held between them.
This token carries that path.
What outlasts the token.
The geometric phase between HYPE and Robinhood has been accruing since the two assets first traded on the same calendar minute. It was there before this page existed. It will be there after this page stops being visited.
The page is the place where the count gets read aloud. The token is the cultural handle by which the count gets remembered for a while. Neither of them creates the phase. They are how the phase, which would have happened anyway, finds a window to be looked at through.
When the token has had its day and the chart eventually stops updating, the integral does not stop being computable, the data does not stop being public, and the procedure does not stop being valid. Whoever wants the count after that can run it themselves. The math is the same math. The constant is the same constant. The chains are still trading.
the procedure · javascript · runs in your browser
// phiarc.js
// the whole procedure this page runs.
// nothing here is private. you can paste it into a console
// and get the same number this page shows.

const N = 256;  // rolling window: 256 one-minute samples

// 1. fetch the latest 256 minute candles for one symbol
//    from hyperliquid's public info endpoint.
async function fetchSeries(coin) {
  const now = Date.now();
  const res = await fetch('https://api.hyperliquid.xyz/info', {
    method: 'POST',
    headers: { 'Content-Type': 'application/json' },
    body: JSON.stringify({
      type: 'candleSnapshot',
      req: {
        coin,
        interval:  '1m',
        startTime: now - N * 60 * 1000,
        endTime:   now,
      },
    }),
  });
  const candles = await res.json();
  return candles.map(c => Number(c.c));   // close prices
}

// 2. detrend each series against its own rolling baseline,
//    then z-score the residual. this strips the secular trend
//    out of HYPE and Robinhood so the 2D trajectory hovers around
//    the centroid and traces actual loops, instead of a noisy
//    diagonal. halflife of 48 minutes is the only knob.
function detrendZ(arr, halflife = 48) {
  const n     = arr.length;
  const log   = arr.map(p => Math.log(p));
  const decay = Math.exp(-Math.log(2) / halflife);
  const ema   = [log[0]];
  for (let i = 1; i < n; i++) {
    ema.push(decay * ema[i-1] + (1 - decay) * log[i]);
  }
  const dev = log.map((x, i) => x - ema[i]);
  const m   = dev.reduce((a, b) => a + b, 0) / n;
  const v   = dev.reduce((a, b) => a + (b - m) ** 2, 0) / n;
  const s   = Math.sqrt(v) || 1e-12;
  return dev.map(x => (x - m) / s);
}

// 3. integrate the signed area element
//        dA = (x dy − y dx) / 2
//    along the joint (hype, robinhood) trajectory.
//    the running total is the cumulative PHIARC phase.
//    positive Φ means hype has been leading,
//    negative Φ means Robinhood has been leading.
function phiarcPhase(xn, yn) {
  const phi = new Float64Array(xn.length);
  let acc = 0;
  for (let i = 1; i < xn.length; i++) {
    acc += 0.5 * (xn[i-1] * yn[i] - xn[i] * yn[i-1]);
    phi[i] = acc;
  }
  return phi;
}

// 4. compose. that is all.
const hype = detrendZ(await fetchSeries('HYPE'));
const robinhood = detrendZ(await fetchSeries('xyz:HOOD'));
const phi = phiarcPhase(hype, robinhood);

// phi[N - 1] is the cumulative geometric phase
// between HYPE and Robinhood across the last 256 minutes.
// the chart above draws phi against ±2π.